Quarterly research
The Cost of
a Patient
What it costs to reach one prospective elective-procedure patient through search advertising, measured against U.S. consumer prices. Published four times a year.
- Current edition
- Second Quarter 2026
- Published
- Four times a year
About the report
What this is, and why it exists
What it measures
The price of a single click on a search advertisement, across a fixed basket of elective procedure terms, tracked monthly since 2021 and indexed so that change — not level — is what you read.
Who it is for
Practice owners and administrators who are asked to set an advertising budget and have nothing to set it against. No prior knowledge of advertising is assumed anywhere in the report.
Why we publish it
We build the measurement systems that produce these numbers for individual practices. The same instrumentation answers the broader question, so we publish the answer — including the findings that do not favor advertising.
How it is produced
The method is fixed before the data is collected and published in full inside the report. No individual advertiser, practice or account is identified, and no patient information is used at any stage.
Inside the Q2 2026 edition
What this edition found
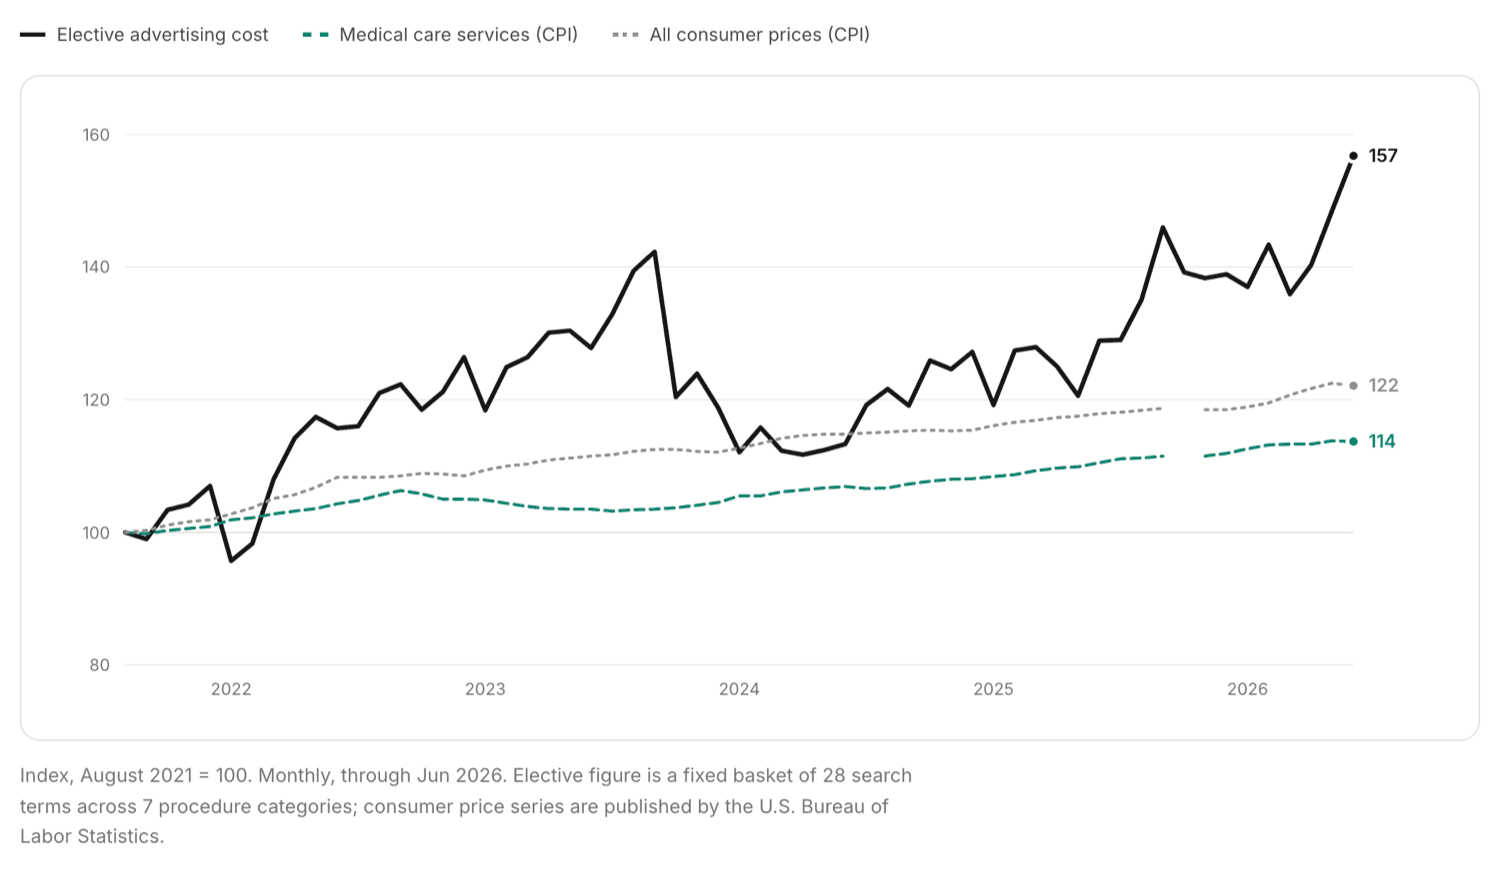
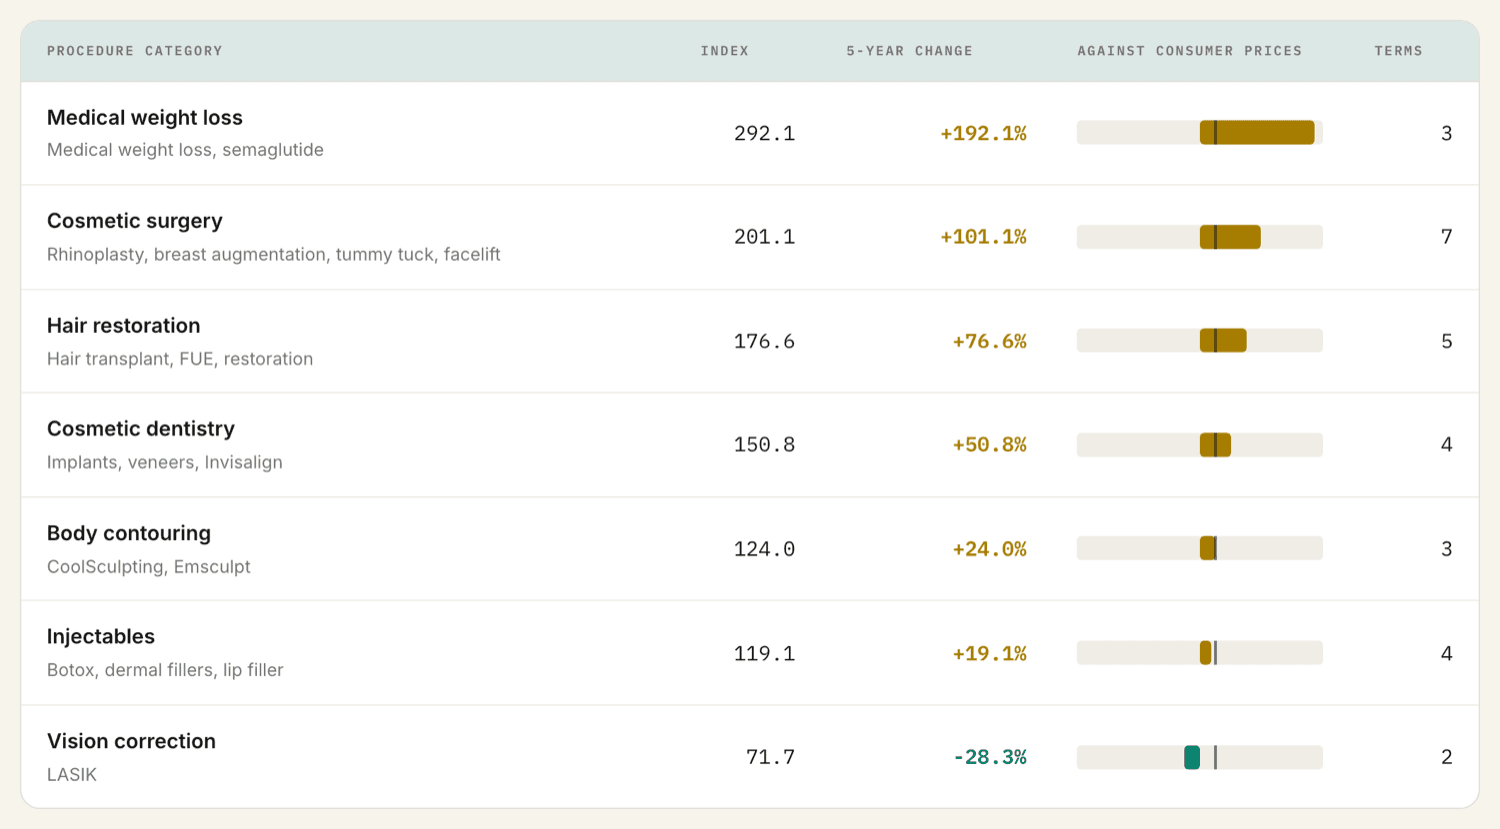
Advertising cost rose 2.6 times faster than consumer prices over five years. Medical weight loss led at +192.1%; vision correction fell 28.3%.
- A five-year index of elective advertising cost against consumer prices and medical care services inflation
- Seven procedure categories broken out separately, from cosmetic surgery to vision correction
- Modeled auction prices tested against money advertisers actually spent, with a non-elective control group
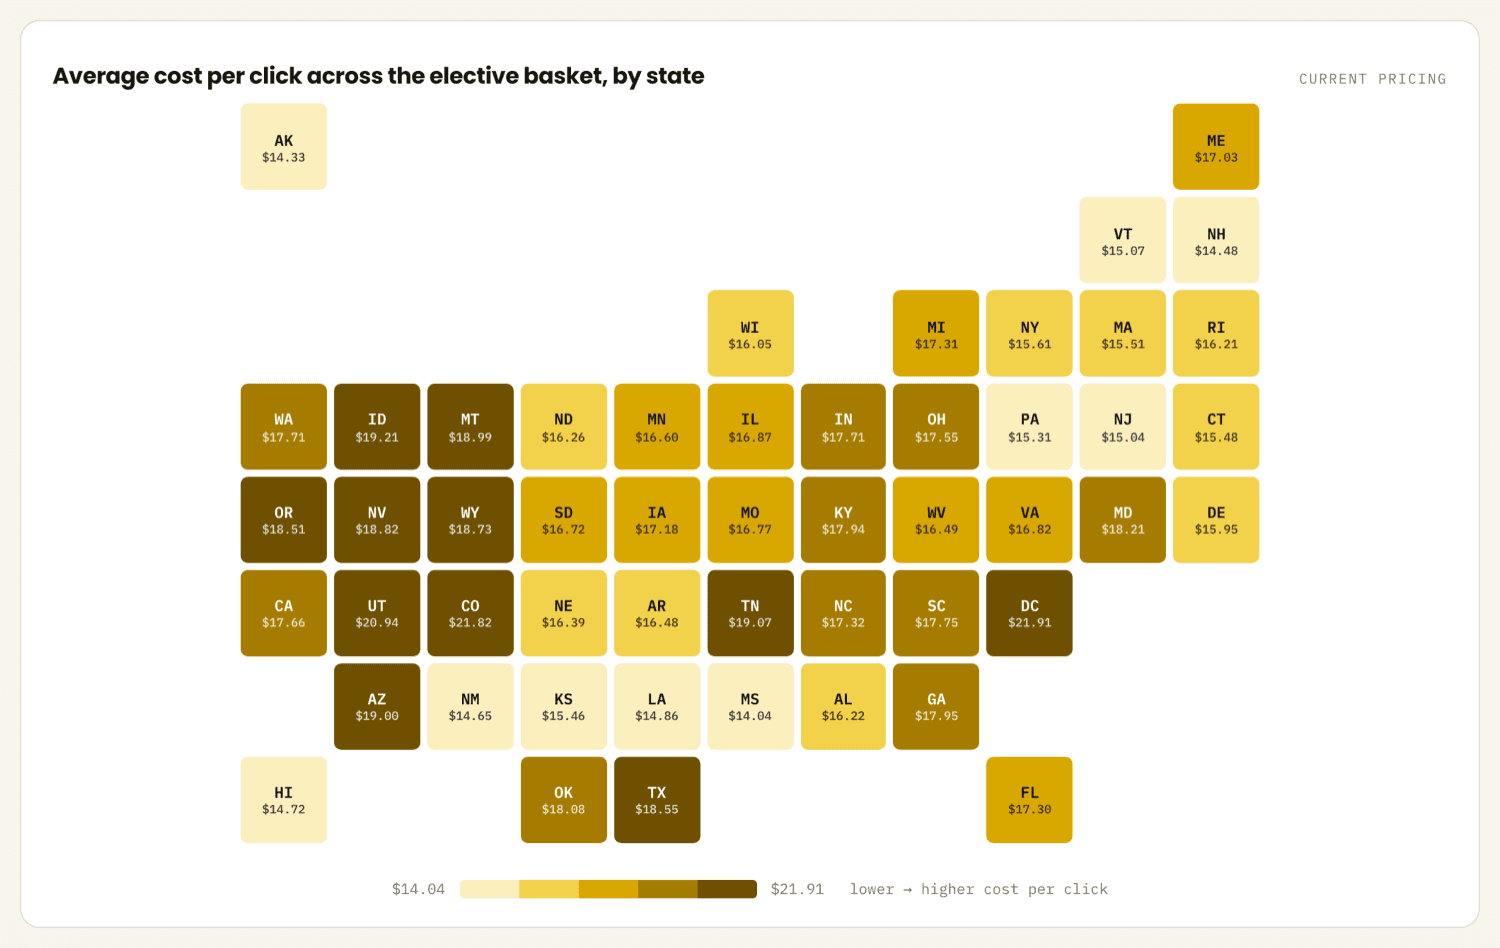
- Cost per click by procedure and by state, with the range across markets
- The full basket, the method, and six stated limits on what the figures can support
A look inside
Four of the figures you will find in it
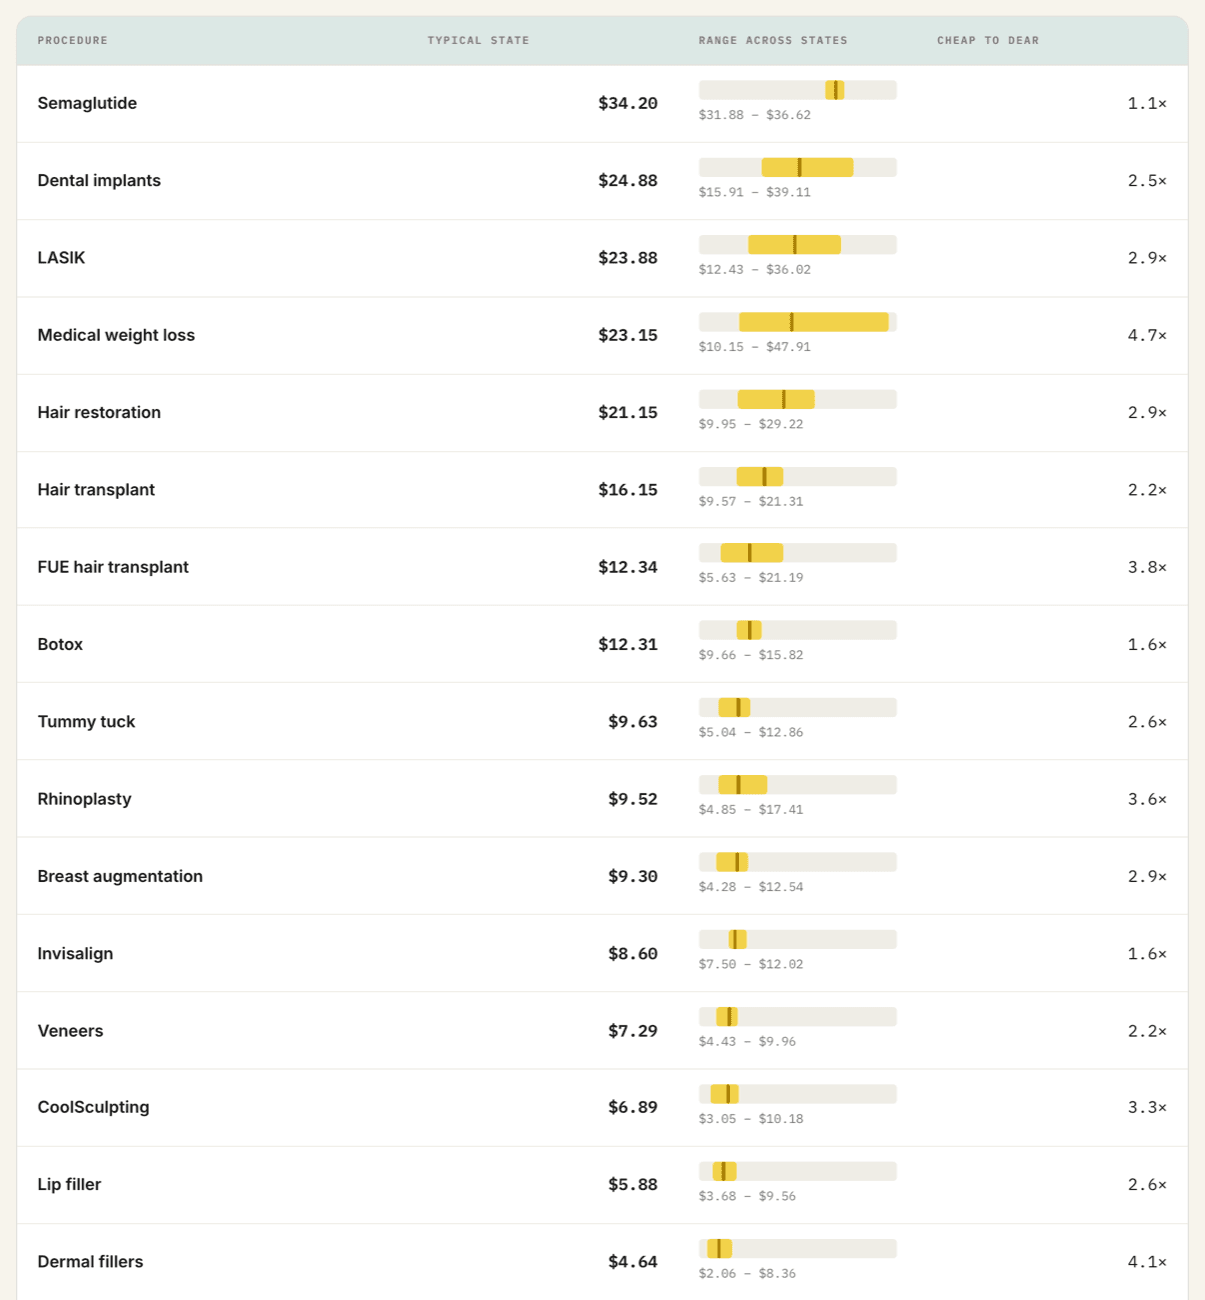
All of it, free, in one 21-page PDF.
Every figure above, the full method, and the six limits we put on our own numbers.
Get it
Get the current edition
Enter your email and we will send the report straight away, plus each new edition as it is published. One email per quarter. Unsubscribe in one click.
Cadence
Published four times a year
Each edition covers one quarter and is released in the quarter after it, because the underlying price data for a month does not settle until two to four weeks after that month ends. Every edition re-measures the full basket, extends the series, and reports what changed. Where a method improves, the change is described rather than applied silently, and prior figures are restated so the series stays comparable.
Editions
Every edition stays available. Verify once and the whole archive opens from this browser.
- Second Quarter 2026Current21 pages · 2026-09-25
Advertising cost rose 2.6 times faster than consumer prices over five years. Medical weight loss led at +192.1%; vision correction fell 28.3%.